SRE Monitoring: Applying the Four Golden Signals
One of the most common questions I get asked in interviews is which metrics should you monitor and why? Of course the answer will vary depending on SLOs, but I turned to Google’s SRE book as a starting guide. In this post I go over the “Four Golden Signals” and my approach to monitoring my own Kubernetes cluster and app.
Overview
My app is self-hosted on Kubernetes, uses Traefik for a proxy/ingress controller, is built on the Flask framework. I’m using Prometheus and Grafana for metric monitoring, and I have the flask-prometheus-exporter already configured to expose application-level metrics.
White-box vs Black-box monitoring
White-box = internal metrics
Black-box = externally visible behavior as a user would see it
White-box monitoring normally accounts for the majority of metrics because it can be leveraged to proactively predict problems occurring, whereas black-box monitoring is solely reactive.
Four Golden Signals
From https://sre.google/sre-book/monitoring-distributed-systems/
The most important metrics for a user-facing system:
- Latency
- Traffic
- Errors
- Saturation (of system resources)
Black-box (external) uptime and latency
I’m using Upptime which uses CI/CD to ping an HTTP /ready path and measure its latency. It’s scheduled to run every 5 minutes which is the maximum frequency allowed by GitHub Actions free runners. Because of this, Upptime is not ideal for real production monitoring but it suits my current use case.
My uptime dashboard: https://www.danielstanecki.com/zhf-upptime/
White-box (internal) uptime and latency
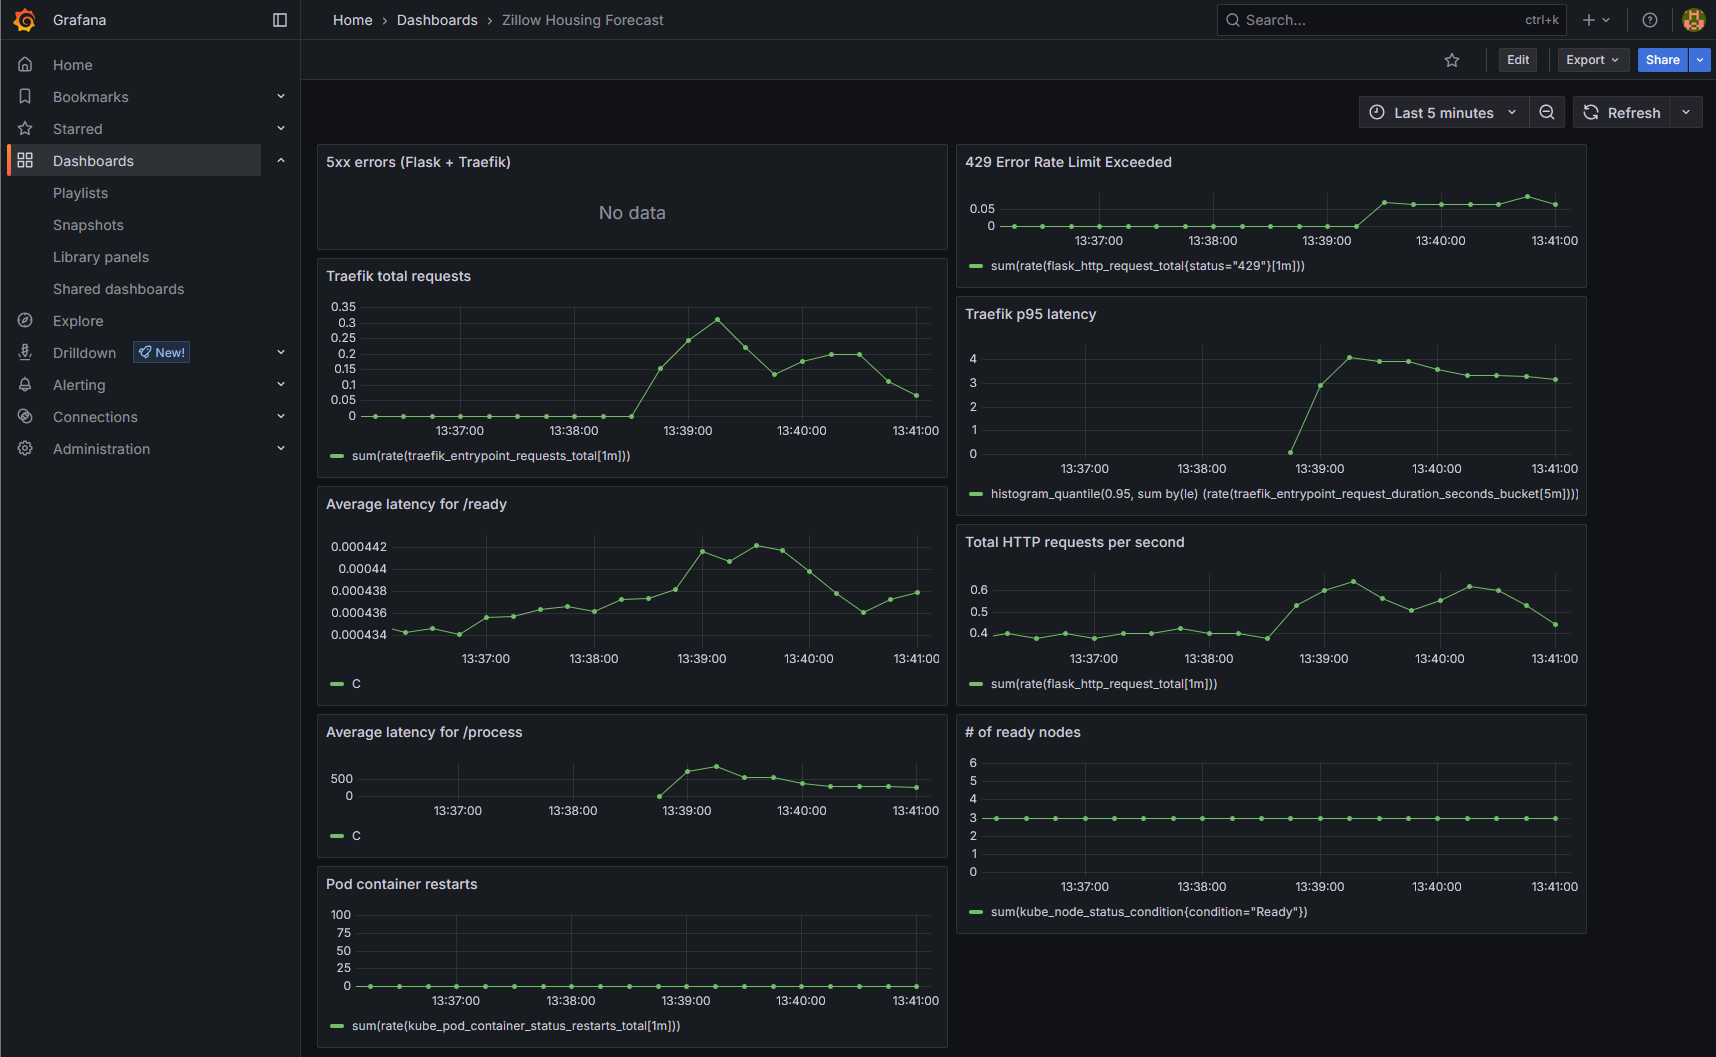
I’m measuring the 95th percentile of all Traefik entrypoint latency, which reveals what the slowest 5% of requests look like. This method often reveals issues more clearly than just the flat average.
histogram_quantile(0.95, sum by(le) (rate(traefik_entrypoint_request_duration_seconds_bucket[5m])))
In addition, I am measuring the average latency for individual HTTP paths. /ready is my health check path and /process is the user action that queries the database and calls the API.
sum(rate(flask_http_request_duration_seconds_sum{job="app-prod", path="/path"}[5m])) / sum(rate(flask_http_request_duration_seconds_count{job="app-prod", path="/path"}[5m]))
Traffic
Show HTTP request total averaged over 1 minute and summed over all flask instances (pods):
sum(rate(flask_http_request_total[1m]))
Show Traefik total entrypoint requests:
sum(rate(traefik_entrypoint_requests_total[1m]))
I am alerting for unusual traffic spikes or dips. A spike might indicate a malicious actor or simply unexpected traffic, in which case I would have to check that latency is not suffering. A huge dip would indicate a problem too since my app is supposed to be always receiving traffic from health checks at least.
Errors
HTTP Status Codes
I’m alerting for any 5xx code. My app hasn’t seen any yet since I deployed it a few months ago, so any occurrence would be unusual.
In my application logic I also configured a 429 rate limiting code that’s returned when a user spams queries, so I’m alerting for that too.
Kubernetes
I’m monitoring the node readiness ratio and alerting if it is not 1. Next most important is the pod container restarts which I’m still deciding on how to alert for. I think any ImagePullBackOff errors warrant an automatic alert and any repeated OOMKilled errors.
Saturation
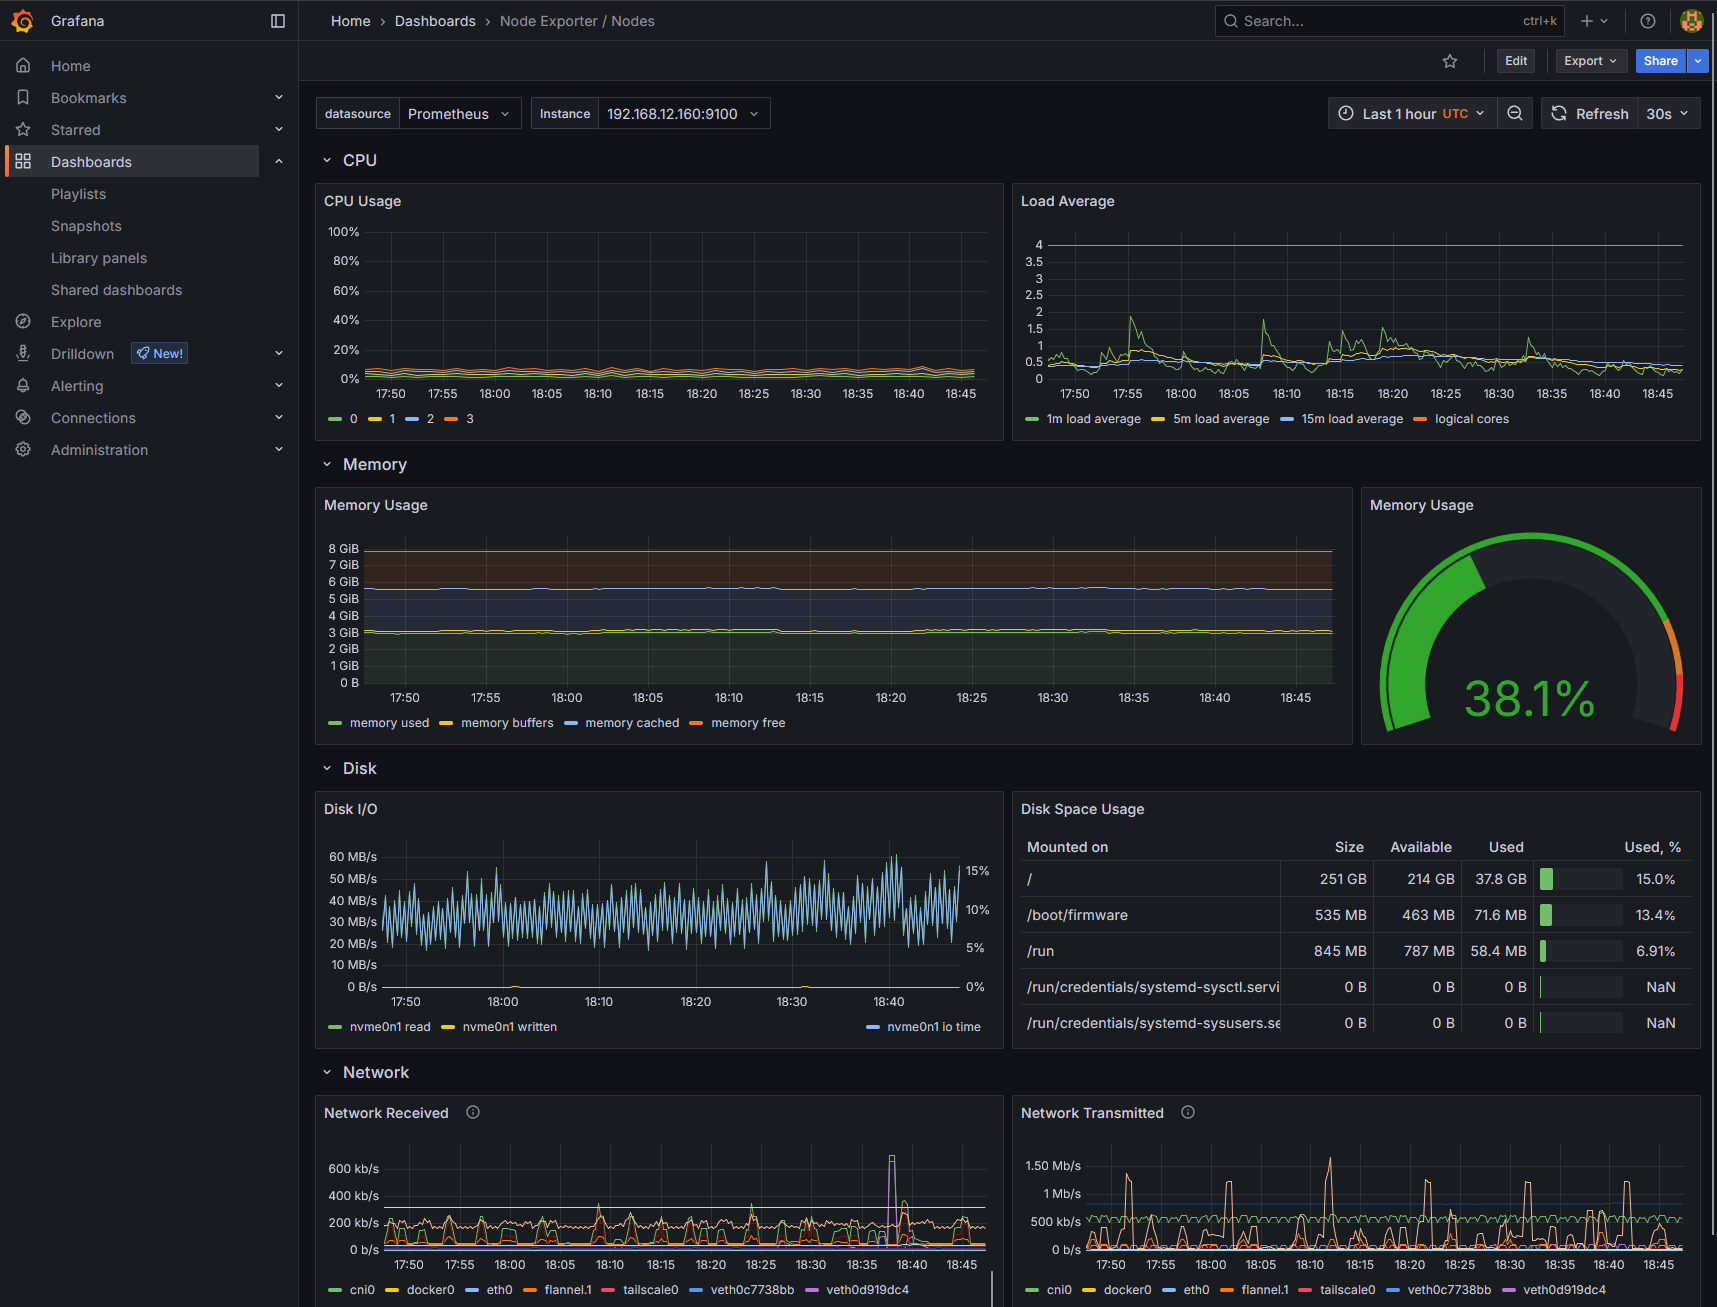
I’m alerting on low disk space (less than 15% free) and low available RAM (less than 10%) since those are the major threats to my app’s availability. It doesn’t see a lot of traffic in its current demo state.
Dashboard Screenshots
 |
|---|
| Latency, Traffic, & Errors |
 |
|---|
| Default Grafana Node Exporter metrics |