Monitor Traefik Ingress Controller in Kubernetes with Prometheus and Grafana
Simple step-by-step guide to configure Traefik monitoring in Kubernetes using Prometheus and Grafana.
Prerequisites: Ensure the following are already installed and running in your cluster:
- Traefik
- Prometheus
- Grafana
Step 1: Verify that Prometheus scraping is enabled and verify the port
Inspect your Traefik deployment and locate the annotations section:
kubectl describe -n kube-system deployment traefik
Pod Template:
  Labels:           app.kubernetes.io/instance=traefik-kube-system
                    app.kubernetes.io/managed-by=Helm
                    app.kubernetes.io/name=traefik
                    helm.sh/chart=traefik-27.0.201_up27.0.2
  Annotations:      kubectl.kubernetes.io/restartedAt: 2025-07-02T17:11:38-05:00
                    prometheus.io/path: /metrics
                    prometheus.io/port: 9100
                    prometheus.io/scrape: true
This confirms that Prometheus is set up to scrape metrics from Traefik on port 9100 at the /metrics path—typically the default for most Traefik Helm deployments.
Step 2: Add “metrics” port to Traefik service
Edit the Traefik service:
kubectl edit service -n kube-system traefik
Add “metrics” port definition to the service spec:
  - name: metrics
    nodePort: 30310
    port: 9100
    protocol: TCP
    targetPort: 9100
(If using k3s default deployment of Traefik): k3s service reboots will reload the default Traefik config unless you add a HelmChartConfig object to persist changes. This can be added to /var/lib/rancher/k3s/server/manifests and k3s will automatically detect and apply it:
kind: HelmChartConfig
metadata:
  name: traefik
  namespace: kube-system
spec:
  valuesContent: |-
    service:
      ports:
        metrics:
          port: 9100
          targetPort: 9100
          nodePort: 30310
Step 3: Create a ServiceMonitor
This step assumes you’re using the PrometheusOperator which is included in the prometheus-kube-stack Helm chart. The ServiceMonitor must exist in the same namespace as your Traefik service (usually kube-system):
apiVersion: monitoring.coreos.com/v1
kind: ServiceMonitor
metadata:
  name: traefik
  labels:
    release: prometheus
spec:
  selector:
    matchLabels:
      app.kubernetes.io/name: traefik
  endpoints:
    - port: metrics
      path: /metrics
      interval: 15s
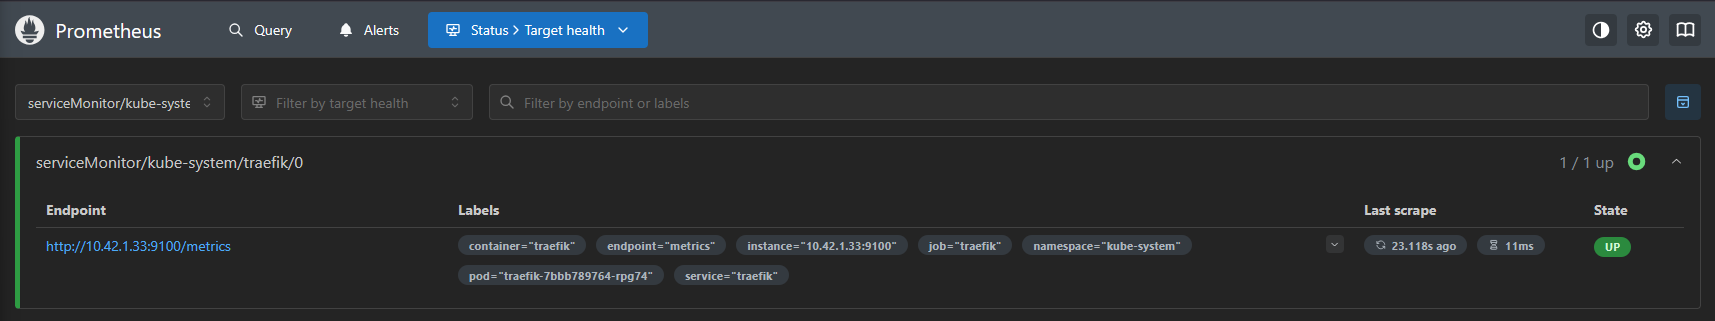
Step 4: Verify target health in Prometheus Dashboard
Open the Prometheus dashboard and check Status > Targets to confirm that the Traefik target is up and healthy:
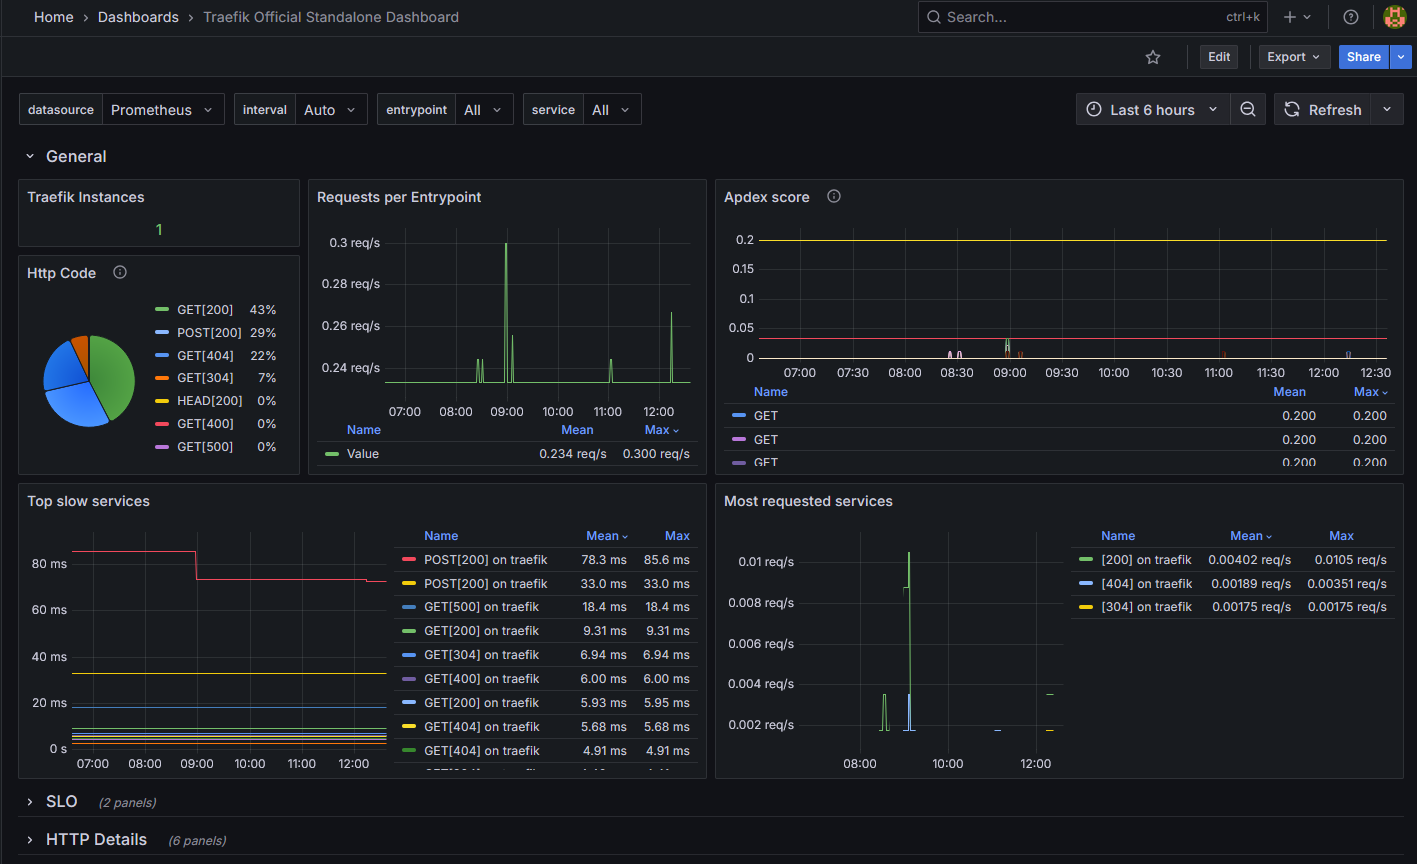
Step 5: Set up a Grafana dashboard
For general use cases, a good place to start is the Traefik Official Standalone Dashboard.
It’s downloadable as a JSON file. In Grafana, navigate to Dashboards > New > Import. Then upload the file. This is how it looks for me after adjusting some of the Prom queries: