Monitor a Flask App in Kubernetes with Prometheus and Grafana (Step-by-Step Guide)
An end-to-end practical guide for setting up prometheus-flask-exporter to measure HTTP metrics and custom counters.
kube-prometheus-stack Installation
helm repo add prometheus-community https://prometheus-community.github.io/helm-charts
helm repo update
kubectl create ns monitoring

# I'm using --set flags to expose Prometheus/Grafana on a NodePort
# Be aware of the security implications if you do this
helm install prometheus prometheus-community/kube-prometheus-stack -n monitoring \
  --set prometheus.service.type=NodePort \
  --set prometheus.service.nodePort=30090 \
  --set grafana.service.type=NodePort \
  --set grafana.service.nodePort=30030
Verify Prometheus is working
Access http://nodeIP:30090 and http://nodeIP:30030
or
kubectl port-forward svc/prometheus-operated 9090:9090 -n monitoring
curl http://localhost:9090/metrics
Expose /metrics on Flask with prometheus_flask_exporter
Make sure that debug mode is disabled in your application code, or else prometheus_flask_exporter will NOT work. It’ll give a 404 error because debug mode uses a reloader by default, so that the code runs in a new process and not the parent process. However, only the parent process is being scraped. If you do need to use debug mode, you can disable the reloader.
At this point Prometheus is only scraping the kube components and it needs to be configured for your pods. I’m using a ServiceMonitor to monitor my frontend app service:
apiVersion: monitoring.coreos.com/v1
kind: ServiceMonitor
metadata:
  name: app-monitor
spec:
  selector:
    matchLabels:
      io.kompose.service: app # <--- YOUR APP SERVICE LABEL HERE
  endpoints:
    - port: http
      path: /metrics
      interval: 15s
On the Prometheus dashboard, you’ll notice your service appears as an unhealthy target (404 error). That’s because the application code needs to be modified in order to expose the /metrics route:
from prometheus_flask_exporter import PrometheusMetrics
from prometheus_client import Counter

app = Flask(__name__)

# Expose /metrics
metrics = PrometheusMetrics(app)
print("Prometheus metrics initialized")

# Example of a custom Counter
# Add to function to increment: forecast_requests_total.inc()
forecast_requests_total = Counter('forecast_request_total', 'Total number of forecast ZIP code queries')

# Example of default counter; counts all HTTP request paths
metrics.register_default(
    metrics.counter(
        'by_path_counter', 'Request count by request paths',
        labels={'path': lambda: request.path}
    )
)
The following metrics are exported by default and you will see them if you curl your /metrics endpoint now:
-
flask_http_request_duration_seconds (Histogram) Labels: method, path and status. Flask HTTP request duration in seconds for all Flask requests.
-
flask_http_request_total (Counter) Labels: method and status. Total number of HTTP requests for all Flask requests.
-
flask_http_request_exceptions_total (Counter) Labels: method and status. Total number of uncaught exceptions when serving Flask requests.
-
flask_exporter_info (Gauge) Information about the Prometheus Flask exporter itself (e.g. version).
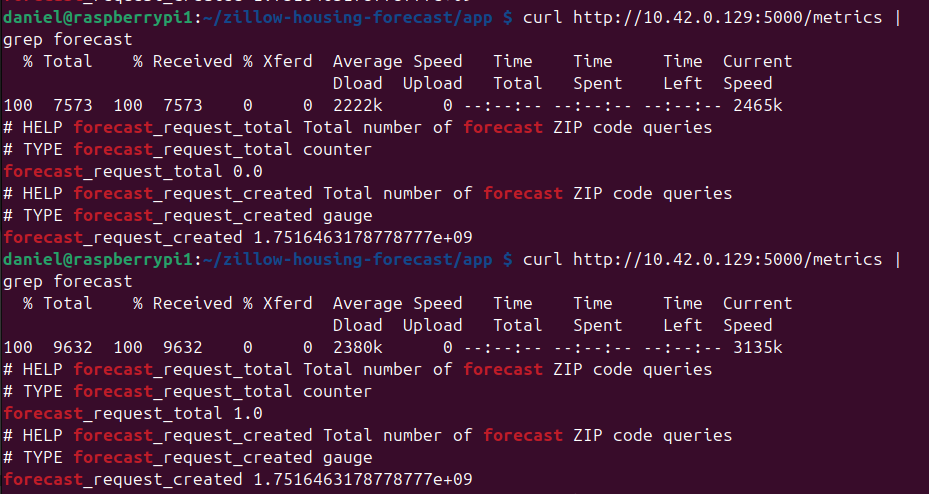 |
|---|
| Example of my custom counter being incremented by a database call |
Grafana set up
kube-prometheus-stack already configures a default Prometheus source for you using DNS.
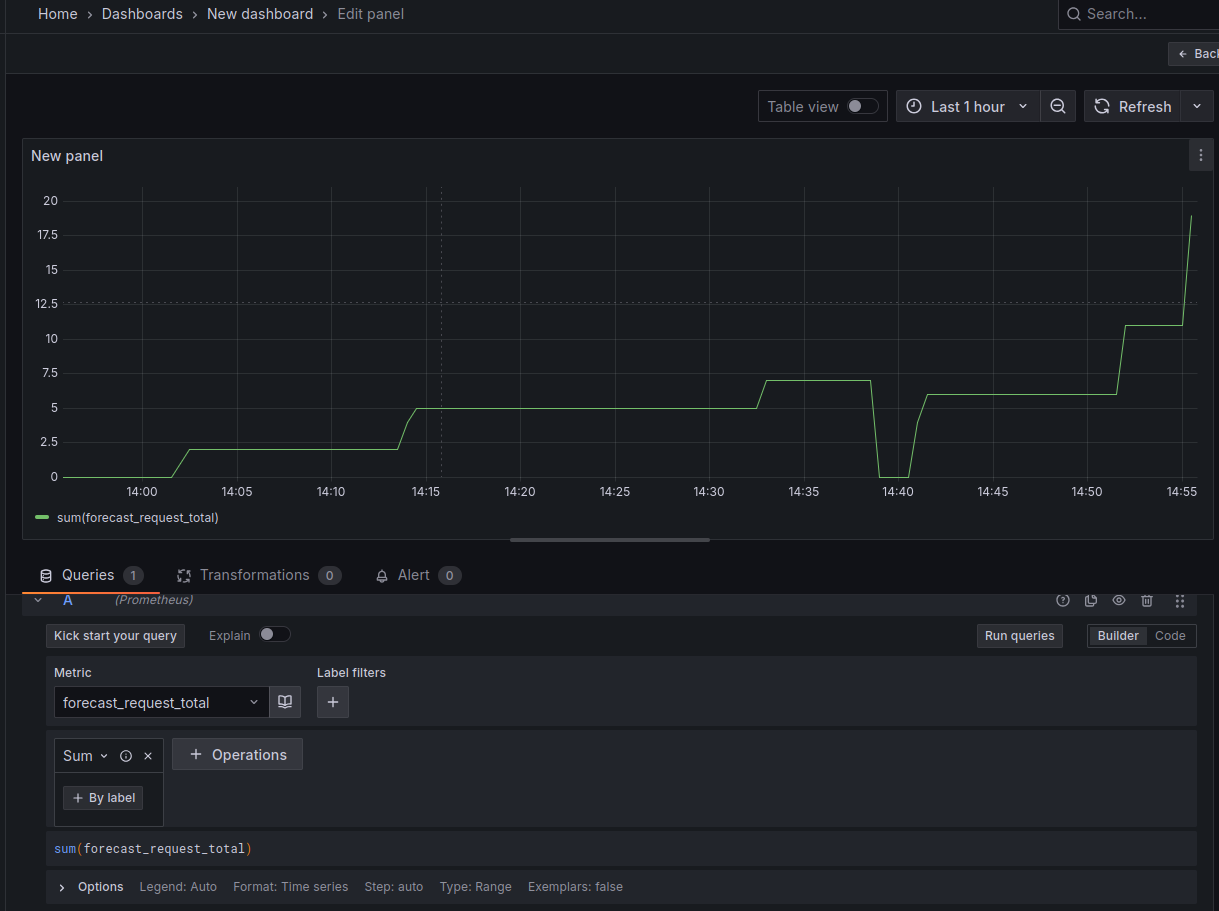
Something to note about the Prometheus ServiceMonitor object is that it monitors the pods individually through separate endpoints. Thus, if you have more than 1 pod behind a service, the metrics are reported separately and must be summated in Grafana like so:
Final Thoughts
I’m just barely scraping the surface here and I’m interested in seeing how deep it goes. I want to set up a cohesive monitoring solution and identify points of failure – what happens if my app receives too much traffic? How much is too much? How can I simulate that and how far can I autoscale on just my 2 raspberry pis?